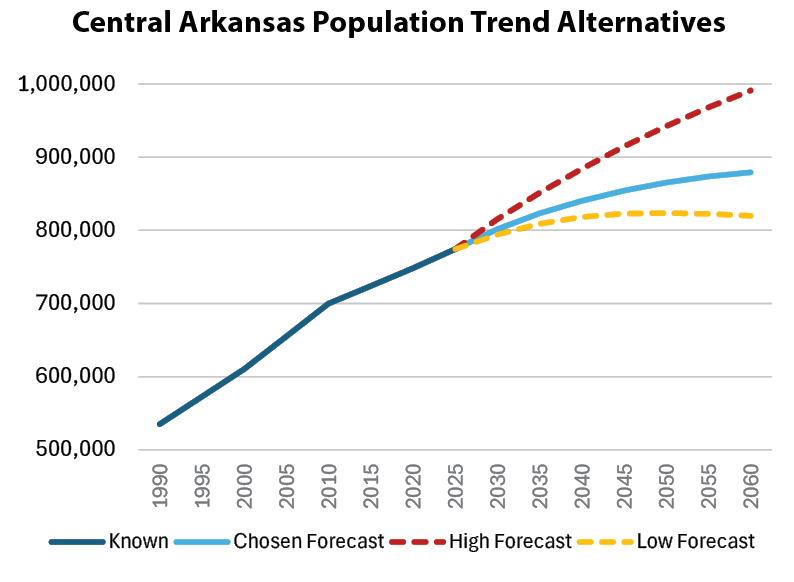
Forecast 2060 for Central Arkansas
The chart at right gives a summary of Metroplan’s newest population forecast for Central Arkansas out to the year 2060 with three alternatives for the future. The “Chosen” (or middle) forecast assumes that regional in-migration will continue at the pace from 1990 through 2024. The “High” option depends on migration rates from 1990 to 2010, a period of fast growth in Central Arkansas. The “Low” scenario uses migration rates from the period 2010 to 2020 when in-migration to the region ran slowly. Figures can be found on page 12.
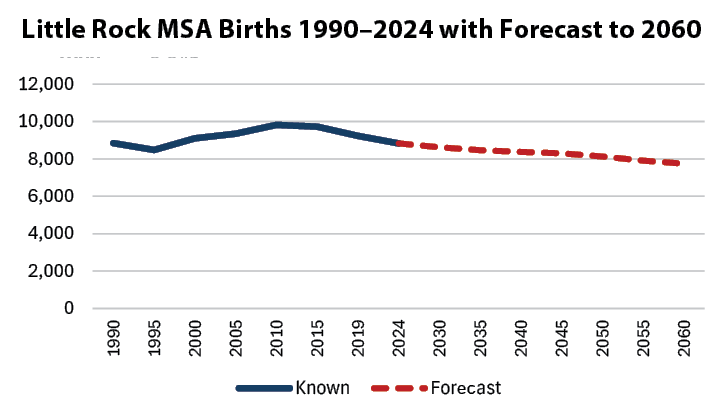
The next chart shows Metroplan’s forecast for births. Birth rates have been declining for decades but the decline has steepened. The forecast assumes this decline will slow gradually over time. Fertility is the biggest question for future population growth. Forecasts by the United Nations and the U.S. Bureau of the Census also assume declining fertility. The housing forecasts shown on page one are based on the population forecasts shown here. Forecasts always have a margin of error, and are modified and updated regularly. The shorter the term
of the forecast, the less error there is likely to be.
The Global Context
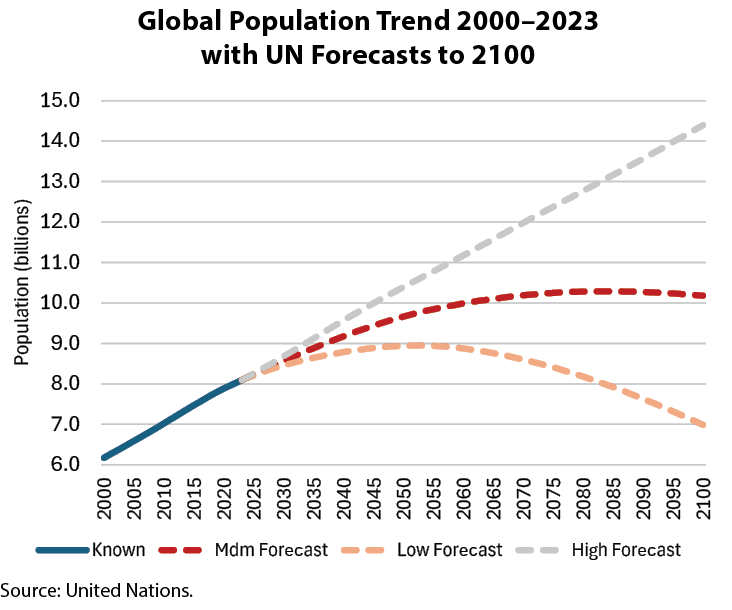
The chart at right depicts United Nations population forecasts through 2100. The “high” scenario must be considered unrealistic.1 Even in the “medium” scenario, population may be declining in 70 years. The “low” scenario predicts global population decline within about 35 years.
The underlying factor is plummeting fertility. By 2023, the global Total Fertility Rate (TFR) had dropped to 2.251 births per female in a lifetime—down from 4.85 as recently as 1950, when global population was surging. TFR is also known as the “replacement rate,” with an underlying assumption that there must be about 2.1 births per female in a lifetime to sustain a stable population. In developed counties, TFR has fallen well below the replacement rate. For the U.S. today, it has declined to about 1.6. The rate for Central Arkansas is closer to 1.65.
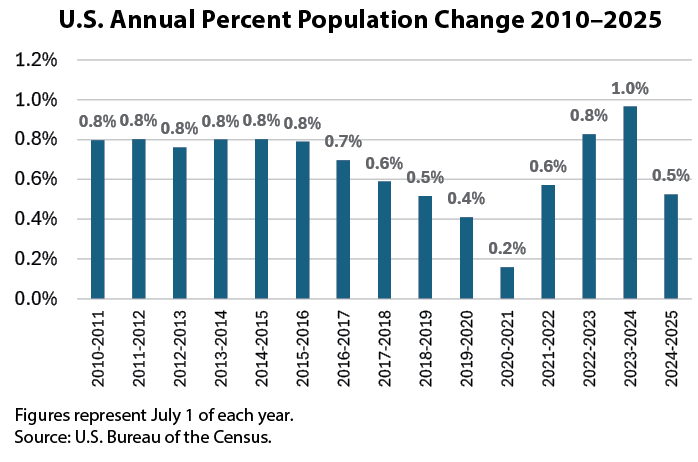
While U.S. policy has recently placed a sharp slowdown on immigration, global trends are also reducing the pool of people likely to migrate. Mexico, traditionally a major source of immigrants to the U.S., now has a TFR of 1.9. Some Latin American countries are even lower: 1.6 in Colombia, and 1.3 in Costa Rica.2 The global population context is shifting.
1. It is based on the assumption that fertility reverses its relentless decline, rising through about 2040. 2. World Bank, data for 2024.
Central Arkansas Population 2026
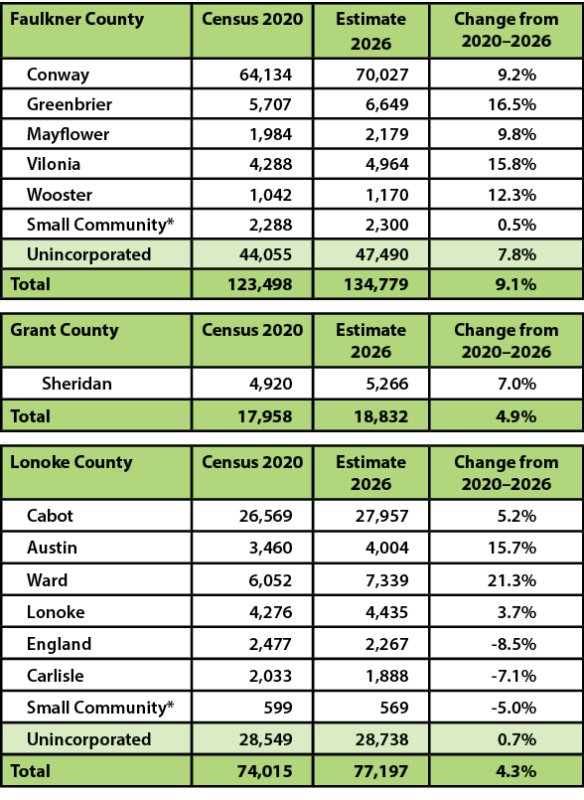
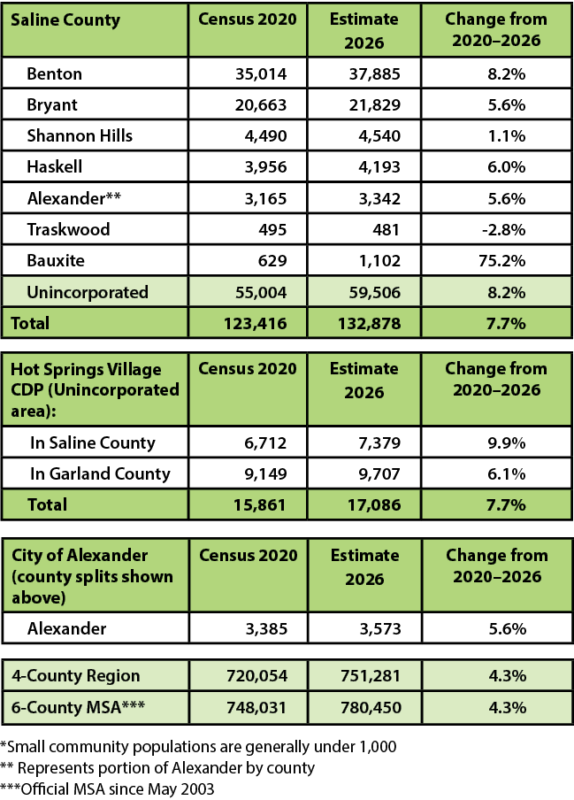
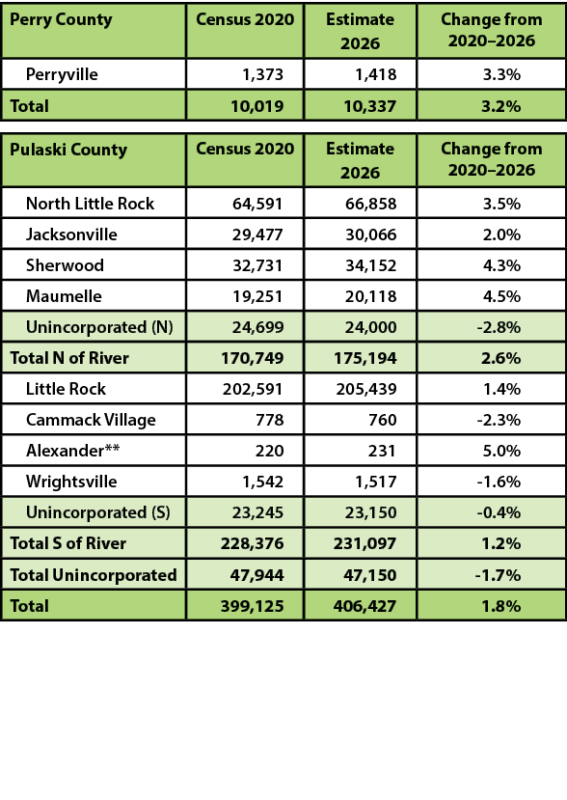
Metroplan estimates that the six-county Little Rock-North Little Rock-Conway MSA reached a population of 780,450 by 2026. A notable milestone is that Conway passed the 70,000 population mark and is now the region’s second-largest city after Little Rock. Benton is the region’s fourth-largest city with a population of 37,885. Maumelle has crossed the 20,000 mark.
Faulkner and Saline Counties are the region’s fastest growing counties. Both counties have seen sizeable population growth outside incorporated areas, although the exact amount is difficult to measure. In unincorporated areas, the lack of housing permit records is a challenge.
Components of Change 2026
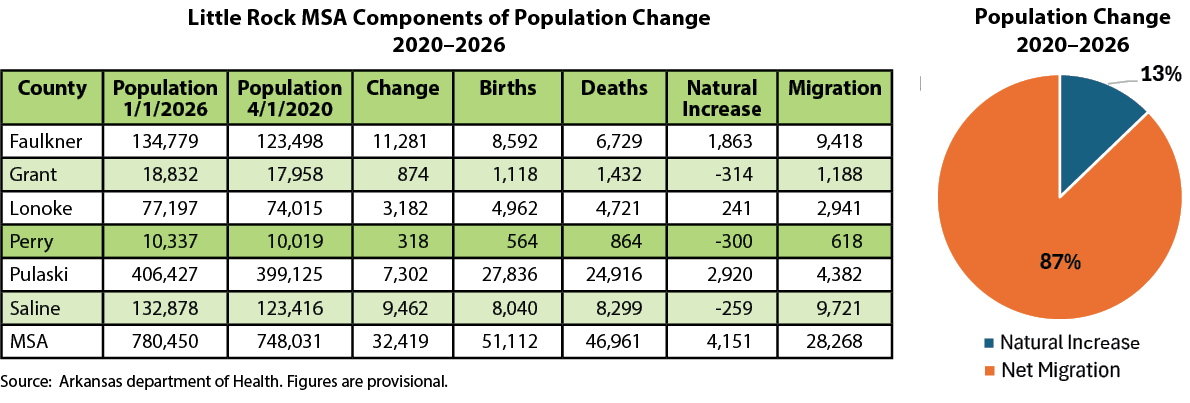
The table below shows the three elements of population change for the region’s six counties. Three of the six counties showed positive natural increase, with more births than deaths in Faulkner, Lonoke and Pulaski Counties. The other three counties saw a small net decrease from natural causes. Elevated mortality rates from the COVID-19 pandemic in the years 2020–2022 were factors in the unusually high death rates. Regional birth rates have declined since 2020, but exceeded mortality in all years.
In-migration has been strongest in Saline and Faulkner Counties, but all counties showed positive net migration flows from 2020 to 2026. Almost all of the region’s in-migration is domestic in nature. Historically one of the region’s sources of new residents has been young people from rural Arkansas seeking education and employment in the Central Arkasnas economy.The regional economy has grown faster so far in the 2020 decade than the previous one, and this has probably helped to lure people to the region.
How Does Migration Affect Central Arkansas?
As the table above shows, population change is a byproduct of two factors, natural increase and migration. Since natural increase has slowed, migration accounts for 87 percent of recent population change.
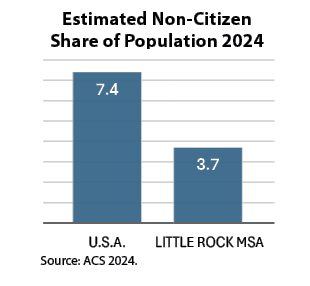
Migration is a net of inflows and outflows. If five people move in while three move out, that is a net migration of +2. While some of the region’s migration is international, most is domestic. Since the local region’s share of non-citizen population is below average, U.S. immigration policies have less of an impact on Central Arkansas.
Population Change
Little Rock-North Little Rock-Conway MSA Population Change 2020–2025
View the full Metrotrends Demographic Review and Outlook 2026 here.